Tradingview is one of the most important software for almost all kinds of traders in the world and especially crypto users. A tradingview crypto tutorial was a necessity because a lot of new users get overwhelmed for too many indicators and stuff. And after opening the account many started to setup tons of indicator and begging to trade based on that indicator only.
Eventually find themselves in confusing and in a feeling of lost situation. Where they can not decide when to buy or sell.
Yes it is true that trading views offer a lot of features. But to be a disciplined trader you need to know a few basics. In this article I will guide you towards tradingview crypto tutorial, how to use the tools. Get benefit of its features and practice on paper trade which will help all new traders and so on. So lets get started
What TradingView Is
Tradingview is simply a trading analysis interface or platform where traders do the chart analysis and technical stuff. Some analytical works done here for instance price analysis, support and resistance level drow down , top down analysis setting up trade plan, put the alarms in critical level and so on.
But, tradingview is not an exchange where we put money and use trading. Even though trading view platforms provide service to connect exchanges in their platform to execute the trades. But it is not similar to the conventional trading platform. You can not hold assets there nor park your money. Pro traders I have seen use an exchange or broker for trading instead of executing from tradingview window. They keep these 2 things separate for more control over their technical analysis and money.
There is also a community part where people share their ideas and charts. Share the scripts of their self made indicators. Tradingview crypto tutorial also provide news relevant to the market.
They also provide calendar which comes in handy to check out financial data and statistics which is essential to understand the trends in the market which this tradingview crypto tutorial will tell you.
Setting Up Your First Crypto Chart
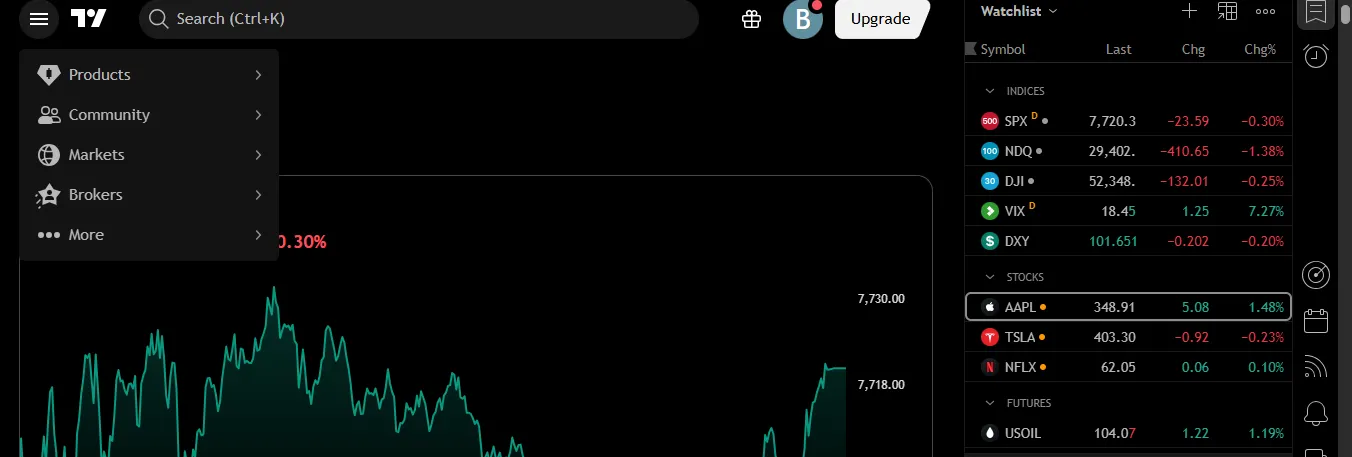
Let’s set up your first crypto chart. After you have opened your account in the trading view, follow the easy steps there. Then they will open the home page where you see something like this in the image
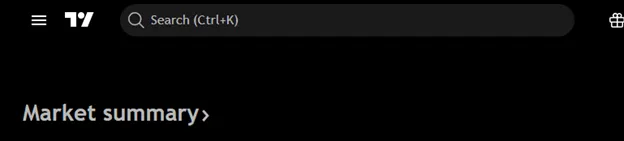
In that search bar, type BTCUSDT.p and the bitcoin chart will appear.
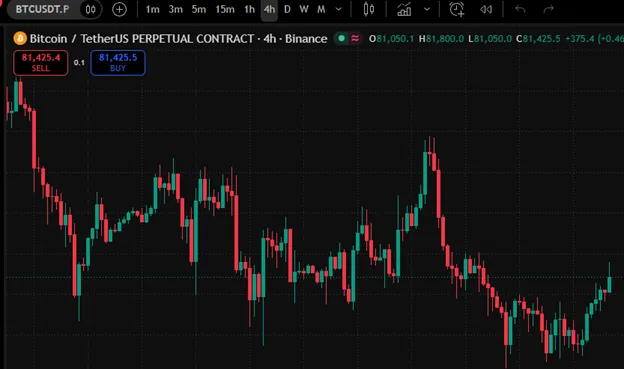
You can choose any coin which you want to trade in future , here I’ll choose bitcoin for an example. While searching, you can choose any exchange you like or you are currently using. The chart suggestion for each exchange will appear there while you type.
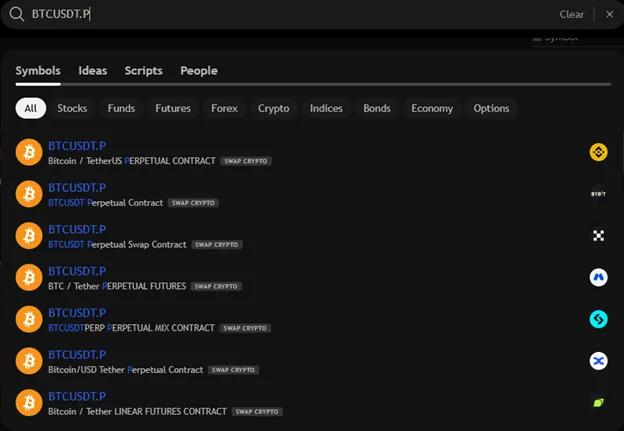
In the draw down after the time frame, you can also add your time as per your choice.
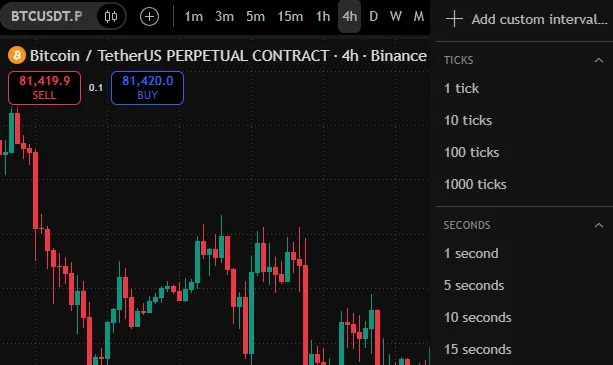
You can do the same for ETHUSDT or SOLUSDT. The difference between USDT.P vs USDT is, dot (.) p is for perpetual contract. For perpetual trading. And the normal USDT chart is for spot trading chart. The price almost stay the same but sometimes they move independently for few points.
How to Change Timeframes on TradingView
The time frame is an important factor in tradingview crypto tutorial. In trading you need almost all time frames and all time frame candles. Depending on your trading strategies.
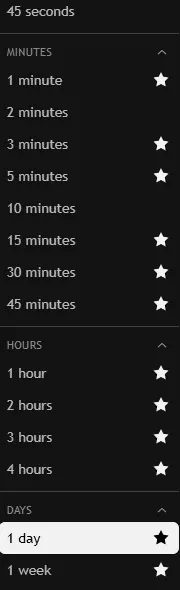
However most traders use a 1,3,5,15 minutes chart along with 1,2,3, and 4 hours charts. With each time frame in tradingview crypto tutorial, you can control of how much time frame the candles gave their moves and trends direction.
Additionally your trading strategies will be easy with your favorite time frame strategy movement. And each time frame the candles represent that time only.
For instance –
- 1m: Each candle represents here only one minute chart.
- 5m: Each candle represents here only five minute chart .
- 15m: Each candle represents here only fifteen minute chart.
- 1H: Each candle represents here only one hour chart.
- 4H: Each candle represents here only a four hour chart.
- 1D: Each candle represents here only one day chart.

From the top time frame box, toggle down as shown in the above image. And select the time frame you would like to trade on or want to view your charts on. And mark them start as shown the images
How to Add Indicators on TradingView
Once you have clicked the indicator button shown in the picture. Then the indicator selection section will appear as shown in the following image. There you can select any indicator and mark them start to your chart .
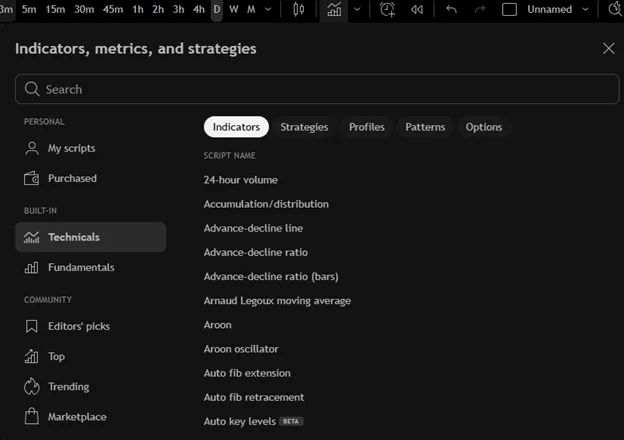
Indicators are good tools for execution of trading decisions.
Few of my favorite indicator are –
Moving average: They show clean price data and commutative movement done in the price action for the last few hours or days even. They also help to check the trends strength and price direction.
Relative strength index or (RSI): RSI helps in measuring the momentum of ongoing price action.
Volume: Volume also helps identify the market activity in certain or selected area of the chart and candles.
How to Use TradingView Drawing Tools
TradingView drawing toolbar is also an important part of executing trading decisions. They situated in the left side of the charts. And with them you can mark the important areas in the chart in price movements.

For instance, some useful tools are:
- Horizontal Line: Mark a specific price level from the chart itself
- Trend Line: Connect all the points on a chart from the candles. In order to visualize the direction of a move.
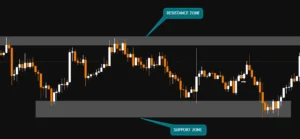
- Rectangle: Highlight the support and resistance areas in the chart.
- Fibonacci Retracement: Measure potential retracement levels between two price points, either from up or down.
- Text and Notes: you can add notes or important explanations to your chart.
How to Use TradingView Paper Trading
Tradingview provides a good opportunity for beginner traders to practise on paper trade inside their platform. You need to activate it by simply clicking some buttons.
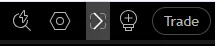
First go to top right corner of the window and you will see the button called [Trade] . It will look something similar to the image below.
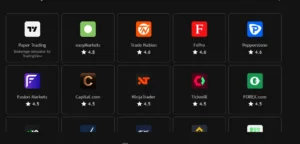
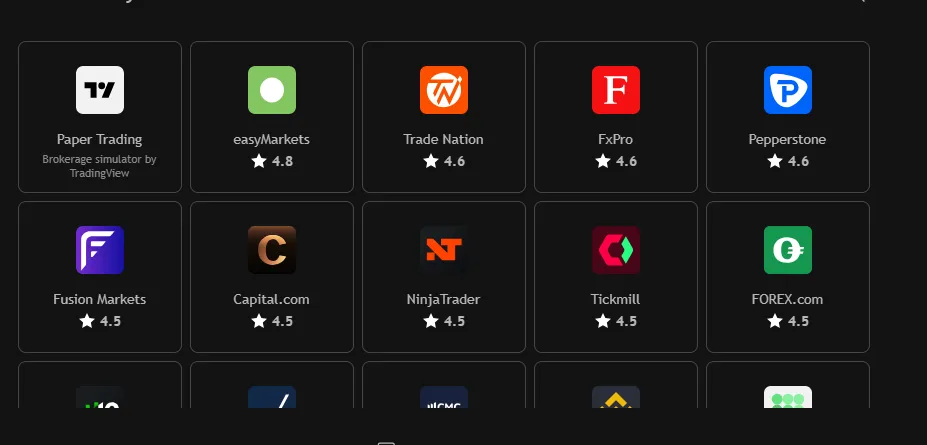
Then click there and all the brokers , exchange and other options will open. You don’t need to panic here. Just click the first button where it says paper trading. [ Shown in the image] .
Once you click it it will ask you to connect your interface into paper trading.
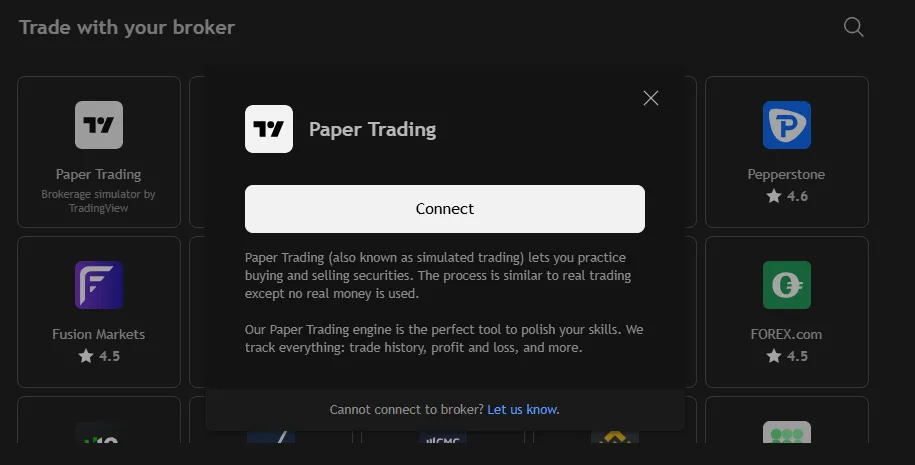
And then there you go. The paper trading option is open for you. You can choose your quantity and limit or market entry to the price. Buy means you go long, and sell button indicates short position in the market.
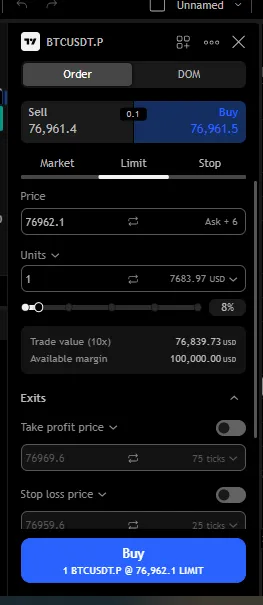
You can put your stop loss and take profit both in this box. Also you can adjust them in the screen by dragging the line of those limits.
Final Thoughts
TradingView becomes much easier at the moment when you know how to use it properly. And where the main tools situated and how to use them properly. This article will help you to use TradingView for your crypto journey. Leah also do live trading session in free discord. You can hop on that from every Monday to Friday 8 A.M Central. If you want to cross check and know more about support and resistance strategy, book a one-on-one session with Leah.
Frequently Asked Questions
TradingView offers a free plan, with limits on certain features and usage. You can begin learning the chart interface without immediately paying for a subscription. Check the current plan details on the official website before upgrading.
Yes. TradingView offers mobile apps that let you view charts, monitor markets, and use supported tools. The interface and some workflows differ from the desktop version.
TradingView is primarily a charting and trading interface. It doesn’t itself act as a cryptocurrency exchange or hold your coins simply because you use its charts. If you connect a supported broker or exchange for trading, the actual account and asset arrangements depend on that provider.
You can place trades through supported broker or exchange integrations where available. You can also use TradingView solely for chart analysis and place trades separately on your exchange.
Look in the chart settings and layout menus for the available reset or default-setting options. The exact controls can vary by interface version. Before resetting, save any layout or drawings you want to keep.