Support and resistance in crypto trading is one of the strategies which many traders use. Usually traders who are professional and high level skills have lots of strategy in their bag to trade with. Some even develop their own strategy which they have found works for them. But support and resistance in crypto trading is a kind of strategy which almost every trader used at some moment in their trading journey. Additionally this strategy is helpful for everyday analysis and making trading decisions.
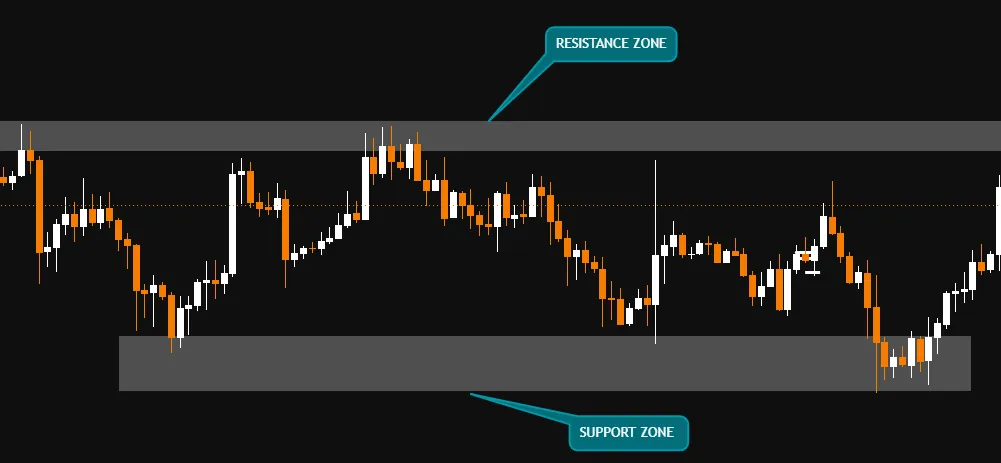
So what support and resistance in crypto trading strategy is right? So mainly if you have noticed in the chart of any coin or asset, you might have seen that price bounces away from a certain price level to the other side. Everytime chart hits that price level it bounces and then returns to the same place again. And if you notice after some hours or certain time, you will see the price is reacting around a specific area from up to down and down to up. That down zone and up zone from where the price is reacting, are basically support and resistance in crypto trading.
That support and resistance line tells us the key level of the price action. And instead of clicking buttons blindly, support and resistance levels help traders to decide the optimised price for buy and sell decisions.
You have to keep in mind that support and resistance levels are not a guaranteed spot for price reversal or reaction zones. So if you blindly trade only based on support and resistance that might backfire a little bit. To understand this support and resistance in crypto trading and the purpose of it is mainly to gather the knowledge and an idea of how price behaves overall. And price actions and behind confluences of the movement ahead.
Also the important skill or take home from this support and resistance in crypto trading strategy is to understand the invalidation point of it. Meaning when does this strategy invalid or will not work in certain scenarios.
In this article I will fully cover how to identify support and resistance from the chart. How to draw the support and resistance and draw them with appropriate levels. How to trade during a bounce from support or breakout of resistance zone and so on. Additionally after reading this article you will be able to identify and learn about the mistakes to avoid and finding the invalidation point in support and resistance in crypto trading.
What Support and Resistance Actually Tell You
Support and resistance usually are a certain price zone where the market struggled to make a move in one direction. And this struggle happened in previous sessions and each time the price is showing a reaction in those price levels.
Experienced traders keep their eyes open there due to next buying or selling pressure might again occur.
Support, means where price decline stops and struggle to move further down in an area.
These kinds of support areas develop in a range where previous sessions’ price action stopped falling. And either stopped there and then bounced from that level to upward direction.
Additionally it also indicates that buyers could have become more aggressive there. Or, the selling pressure got weak there.
Resistance, means upward price movements stopped or struggled to continue to move up further in a certain price level or went downward from that area.
For instance, if BTc price falls down around $62000 and then recover from there. That area of 62k is usually marked as a support zone. And then if it bounces back to $72000 and struggles to move past that price area upward or goes down from there. That area is usually marked as a resistance zone.
Experienced traders watch those levels and areas carefully. Because when the price returns to that level, we might see some reactions or change of conditions from that area.
Why Support and Resistance Are Better Treated as Zones
Many traders draw a line in the support resistance line as a single horizontal line. And then they keep expecting the price to respect that line to the accuracy. However, market , price action and candlesticks don’t react to that to full accuracy. It is not designed to do so.
Zones are drawn in something like a boxed shape area on the chart. And it helps more than the line itself. For instance,if bitcoin has pumped high around $93k to $96k zone in previous dip. Then the future dip might occur a little bit below $92900 before going up towards $130k. But if you have drawn a single line on $96k as support then it is a greater possibility for you to miss that support zone and your profitable entry. And this small dip from $96k line to $92.5k dip might look to you like a breaking down scenario from the support. Which in reality isn’t.
For the resistance zone, the same thing might appear. If you draw a line instead of zone , then visiting the zone above your line might look to you as a breakout and after your entry, it could crash down towards support zone. Resulting loss in your trade.
Weighing these risk factors, many traders draw zones instead of the lines. And that is the key importance of it. The zone in fact tells us the importance of that area, and interest of price action in that zone. It might not hold the entire area however and there comes the idea of stop loss.
Keep eyes on swing highs, swing lows, and concentration of the candles and wicks before drawing the support and resistance zone. Don’t look for perfection and a single line while drawing the support and resistance zone. Just focus on the above elements and the zones and you are good to go.
How to Identify Support and Resistance on a Crypto Chart
So, to identify and draw the support and resistance zone you don’t have to be too stressed and take help from tons of indicators. You can do this on your own with ease. Just open any charts of any coins. Lets say you have opened a bitcoin chart. Now look for the area where price all of a sudden made a turn (either upside or downside). Look for the zones where the wicks were heavy and market changed its directions. Or kept getting stopped or struggling to go beyond that zone and so on.
Let me organise and clearly explain those to you below –
Start with previous swing highs and swing lows
It’s easy. Swing high is the local top of the candles. The price peaked there and then started to fall down from there. Swing low is the local bottom zone where price dropped and then stopped going down, then reversed back with the upside move.
So after you have identified swing high and swing lows. The previous swing high will help you to identify the resistance zones and conversely previous swing low can help you to identify the potential support zones. There could be some in between undecided zones but try not to consider them immediate support or resistance zones. Usually there is a good gap between support and resistance zone.
Pay attention to Higher Timeframes First then lower timeframe
Start with a higher time frame. It is one of the easiest ways to do so. Go to the 4 hour chart first and then check for swing high and swing lows. Mark them, mark those areas where price significantly made reaction or changed direction. Thats your swing high resistance and swing low support zone on a higher time frame. Then move to your 15 minute time frame and you will have now clear picture of the overall probability in the next direction.
Keep in mind, the higher time frame like the 4 hour time frame will help you identify proper support and resistance. And the lower timeframe like 15 minute time frame or 5 minute tf will help you to decide trade entry point or entry zones.
Pay attention to repeated reactions
You are watching chart and observing, then you notice for instance the price of a coin went up towards $1.5 and then goes back down again. Then after a couple of sessions, it came towards $1.48 then went back again. Later again in another session it started to struggle on around the $1.5 price range. These are the areas you need to pay attention to. Repeated reaction zone and the potential resistance or could be support.
Keep eyes on to the Candlestick Wicks
Wicks on the candles carry a lot of information about potential support and resistance. Wicks may go lower then move back up, which might indicate price dipped and recovered from that dip. Yes, remember to wait for candles to close.
Likewise, if the wick is from the upside to the downward. That might indicate that price got rejected from that point and fell back towards support zone.
Which Support and Resistance Levels Matter Most?
Mainly there are few levels which are more important to look for amongst other support and resistance levels. From which the price usually has shown reaction in movement.
Firstly, major swing high and the lows are important. Secondly you have to keep eyes for the psychological price. Mainly the complete numbers like, $10, $50, $100 etc. are the psychological selling point or price. Usually traders or sport holders take profits in those prices.
Thirdly, Look for previous day highs and lows, mainly the previous breakout or resistance area. Price usually visits those area later again.
Additionally, mark the previous session high or lows to find out more confluences and it will help finding your support resistance zone easier.
How Traders Utilize Support and Resistance
Traders utilize this support and resistance levels usually by trading in those levels. They follow few simple strategy like –
Trading during price bounce. Like when price start to fall back in the support zone they take risk to trade long from the support towards upside and put stop loss below the support level.
They also try trading during breakout from the resistance zone. Like if price keeps getting rejection from the resistance line but they have found out that price just broke that resistance level. Then traders trade for long from that zone towards upside and put stop loss below the breakout line.
Additionally, traders wait for price support levels to break so that they can short the chart after the breakout.
So these are some trades which experienced traders take risk on. Also to keep in mind that these zones are not guaranteed to make money or don’t always behave in our way. Which is why risk management is key and experience and practice required to execute those strategies.
How to Tell a Real Breakout From a Fakeout
Yes it is important to understand fake out or fake breakout from the real one. Well, its not easy though. But if you keep your eyes on a few macro changes then you can detect this too. Like
- After the breakout, price however, closes back inside the previous support or resistance zone. Keep in mind fake breakout will always come back inside in closing candles or next closing candles.
- The breakout is not consistent in the directional move.
- Price fails to hold the line in the breakout zones on retest.
There are a lot more to see but with the experience you will be able to understand them more easily over the time.
Common Support and Resistance Mistakes
Don’t draw a line every level or whenever you think that is it. Not every wick, every price rejection matters. Learn to identify the real ones with backtesting and practise.
Never leave your trade confluence on guessing. If it does first tap second tap don’t believe blindly that on third tap will hold the zones. There is no guarantee that this support zone will hold even on the second tap either.
Another mistake traders make is, they jump in before the candle closes. Before the candle closes and the trend confirmation you can’t come to conclusion on anything. Also if the trend is upward you can’t think of a downward movement. Always keep the trend direction in mind.
And don’t move stop loss whenever you see the level is failing. This is it so far. If you can maintain the above discipline to avoid the mistakes, you will benefit from this strategy.
Final Thoughts
Support and resistance is definitely an important confluence in trading. However they are not to be relied on blindly. You should have practiced enough and followed the levels, avoided the mistakes we discussed and identified the fake out properly now. And in our discord we do trade on live Monday to Friday 8:30 AM central. If you want to cross check and know more about support and resistance strategy, book a one-on-one session with Leah.
FAQs
Support and resistance can help organize price action, but they are not perfectly predictive. Crypto volatility, market news, liquidity conditions, and changes in buying or selling pressure can cause price to break a previously respected zone.
That is one possible trading approach, but only if the setup fits your strategy. Look for confirmation, consider the broader trend, and calculate your risk before entering. Support can fail, and resistance can break.
There is no single best timeframe for every trader. Daily and 4-hour charts can help identify broader levels, while 1-hour, 15-minute, and 5-minute charts may help with intraday planning and entry timing.
When price breaks below support, traders may watch that former support area as potential resistance on a later retest. The opposite can happen when price breaks above resistance and subsequently holds it as support. This is often called a support-resistance flip.